| |
Spectral Processing & Analysis - Applications &
Techniques in NMR Spectroscopy
Scientists at the NIH and J.W. Goethe University,
Germany have used FELIX for spectral processing and
analysis of NMR data.
Improved Spectral Resolution Using Linear Prediction
Frank Delaglio, National Institutes of Health, Bethesda,
MD, USA.
Easy, Fast Extraction of Coupling Constants from
Multidimensional Spectra
Prof. C. Griesinger and A. Rexroth, Institute of Organic
Chemistry, J.W. Goethe University, Frankfurt am Main,
Germany.
ND Peak Fitting for More Accurate Spectral Data
Extraction
-----------------------------------------------------------------------------------------------------------------------------------------
Improved Spectral Resolution Using Linear Prediction
 21kb 21kb |
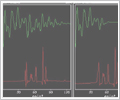
In the right panel, a 64 data point FID
has been zero-filled to 128 data points and
Fourier transformed into its 1D spectrum. In
the left panel, the same data were extended
to 128 data points using the enhanced linear
prediction capabilities within FELIX. The
linear prediction clearly improves the
resolution of the resulting spectrum. |
Fourier transformation is an indispensable tool for
converting time-domain data into interpretable spectra,
although its limitations in reconstructing spectra from
small numbers of measured points have been highlighted
recently in multidimensional spectroscopy. The usual
Fourier processing requires artificial dampening of the
measured data with a window function (apodization),
followed by extension of the data by zero filling. In a
sense, this procedure discards precious data since the
original signals are attenuated. In the case of data
with many points, this loss can usually be tolerated.
But in the case of data with few points, Fourier
processing leads to excessively broad spectral lines, as
well as extreme truncation artifacts, which make spectra
difficult to analyze.
The FELIX implementation of linear prediction solves
this problem by extending the measured data with
synthetic points before Fourier processing (Figure 1
-21kb). By extending the data, the line-broadening
caused by apodization is reduced, and truncation
artifacts are minimized. The FELIX macro approach to
spectral processing is especially helpful since it
allows dimensions to be processed or reprocessed
conveniently in any order. The FELIX implementation of
linear prediction also includes facilities for
mirror-image linear prediction(1), a clever method
designed to exploit the symmetry of NMR time-domain data
in order to predict larger numbers of signals accurately
from a limited number of data points. Together, these
features and enhancements make FELIX an excellent
solution to the challenge of multidimensional spectral
processing.
Contributed by Frank Delaglio. Frank Delaglio is a
software scientist at the National Institutes of Health
in the lab of Dr. Ad Bax. He has been a consultant of
Accelrys since 1991.
-----------------------------------------------------------------------------------------------------------------------------------------
Easy, Fast Extraction of Coupling Constants from
Multidimensional Spectra
 17kb
17kb
 38kb
38kb
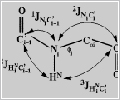
When determining the structure of proteins, torsion
angle information resulting from NMR spectra can
tremendously speed-up the convergence rate of structure
calculations and provide more precise structures.
Recently, a method(2) was designed to measure with high
sensitivity 3J(HN,C') coupling constants in proteins
that are associated with the backbone torsional angle φ.
Three 1H,15N-HSQC spectra are recorded displaying the
couplings to the carbonyl resonances: (a) in an E.COSY
manner, (b) only during the detection of the HN
resonance, and (c) not at all (Figure 2 -17kb). The
desired 3J(HN,C') coupling constant can be extracted
from these three spectra for each crosspeak by
determining the 2J(HN,C') coupling, first from the
E.COSY type experiment, then with this knowledge fitting
the HSQC (c) by convolution with the already determined
2J(HN,C') coupling and the desired 3J(HN,C') coupling to
the HSQC (b). The implementation of this procedure for
each crosspeak in a set of three 2D HSQC's or 3D HNCO
spectra is done by manual or automatic peak picking of
all crosspeaks in the spectra and storing them in the
database. If an assignment already exists, only the
E.COSY type crosspeaks have to be picked again, since
two regions have to be defined per individual crosspeak.
The flexible FELIX macros provide all the 3J(HN,C')
coupling constants in a fully automatic, reliable way.
The easily-extended 3D version of the same macro offers
the opportunity for analyzing 3D HNCO spectra in cases
of severe overlap. The output consists of the two
coupling constants of interest. In the graphic window,
the reference and the fitted traces appear, as well as
the difference between the experimental trace and the
trace obtained by the best fit (Figure 3 -38kb).
Contributed by Prof. C. Griesinger and A. Rexroth,
Institute of Organic Chemistry, J.W. Goethe University,
Frankfurt am Main, Germany.
-----------------------------------------------------------------------------------------------------------------------------------------
ND Peak Fitting for More Accurate Spectral Data
Extraction
 49kb
49kb |
Peak fitting is critical for the accurate interpretation
of NMR spectra. Accurate peak centers are required for
computer-assisted resonance assignment, especially in
higher dimension spectra where the digital resolution is
low. The calculation of many spectral properties, such
as relaxation and NOE build-up rates, are dependent on
the accurate measurement of peak linewidths, intensities
and volumes. |
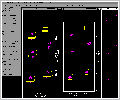
FELIX contains extensive optimization
procedures for fitting 1D, 2D, 3D and 4D peaks. The
centers, widths and volumes can be optimized
independently or simultaneously in any combination or
order with Gaussian or Lorentzian lineshapes using a
linear least squares fitting routine. The residual
volumes can be visualized quickly to verify the accuracy
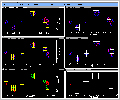
of the fit. Frames 1-3 of Figure 4 (49kb) depict the
experimental, model and residual crosspeaks within a
small region of a 2D NOESY spectrum of Zinc Rubredoxin.
Frames 4-6 depict the experimental, model, and residual
crosspeaks after optimization of the peak centers, peak
widths, and volumes was conducted. Note that both
positive (red) and negative (green) contours are plotted
in the residual data (frames 3 and 6) and that very
little residual intensity is left after fitting of the
peak footprint (frame 6).
-----------------------------------------------------------------------------------------------------------------------------------------
Back to top
More Case Studies |
|
•
Product Overview
•
Felix 2D/ND
•
Modules
 Felix 2D/ND
Felix Assign
Felix
Autoscreen
Felix Model
•
Case Studies
Spectral
Assignment
Spectral
Processing & Analysis
Structure
Calculation & Analysis
•
System Requirements
•
How to Try/Buy Felix |